Visual Analytics for Process Monitoring: Leveraging Time-Series Imaging for Enhanced Interpretability
Journal of Process Control,
Ibrahim Yousef, Aditya Tulsyan, Sirish L. Shah, and R. Bhushan Gopaluni
[PDF]

Click to enlarge image.
Abstract
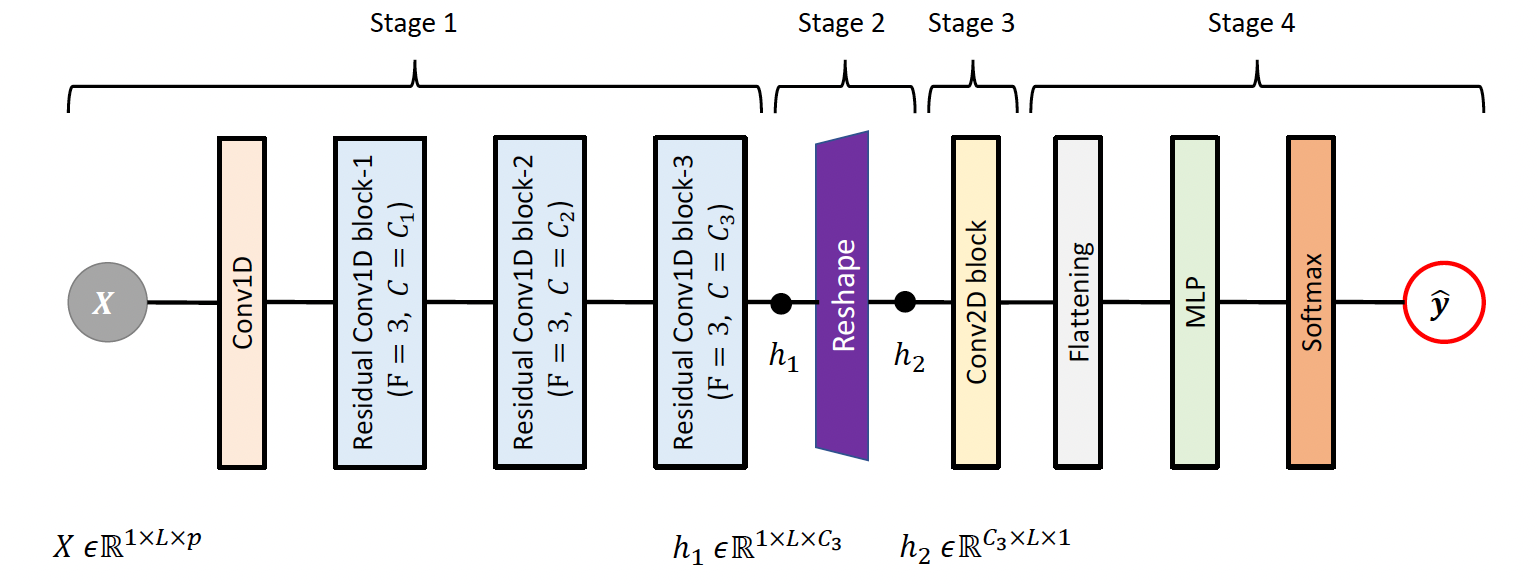
In the era of big data driven by the advent of the Internet of Things (IoT), process industries face the challenge of analyzing massive and complex data to extract relevant information for effective process monitoring. Despite exploring various approaches, scalability and interpretability continue to present practical limitations. To address these limitations, we propose a new framework called visual analytics. Visual analytics offers a new perspective on solving process monitoring problems. It involves transforming historical process data into visual clues, thereby converting traditional fault detection problems into image classification problems. This approach allows process experts to visually analyze patterns and textures within the data, making interpretation much easier compared to traditional time domain analysis. Moreover, by treating process data as images, visual analytics can leverage a wide range of computer vision techniques, including convolutional neural networks (CNNs), to accurately classify and detect faults. By integrating human visual perception with advanced computer vision techniques, visual analytics enables the effective analysis of massive and complex process data. To empirically validate the proposed visual analytics approach, we conduct experiments on both the simulated continuous stirred tank heater (CSTH) benchmark and the industrial arc loss benchmark. The experimental results from both benchmarks demonstrate that the proposed visual analytics approach yields competitive performance in predicting process faults while enhancing interpretability by providing meaningful and informative visual representations.
Read or Download: PDF