Interactive Visualization for Diagnosis of Industrial Model Predictive Controllers with Steady-State Optimizers
Control Engineering Practice,
Shams Elnawawi, Lim C. Siang, Daniel L. O'Connor, Bhushan Gopaluni
[PDF] [Slides] [Thesis] [Video]

Click to enlarge image.
Abstract
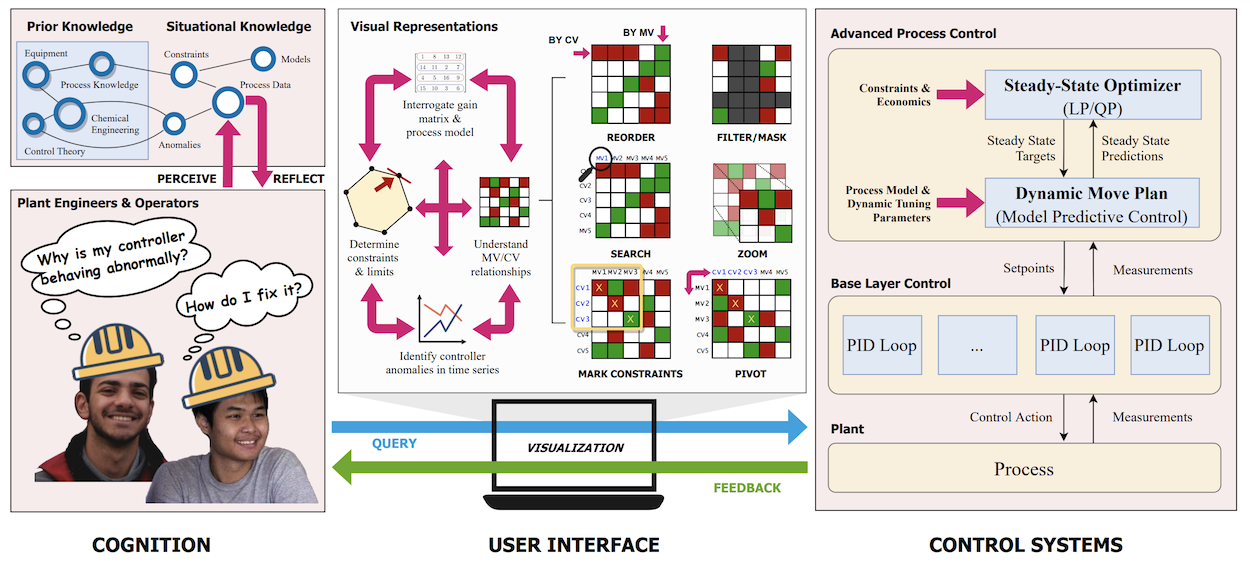
Model Predictive Controllers (MPCs) are widely used in the process industries and are typically implemented with an integrated Linear Program (LP) optimizer in the form of two-stage LP-MPC systems. Despite significant control-theoretic advances in MPC design and performance evaluation in academia, there is still a gap in addressing operational issues in real-world MPC controllers. In particular, engineers and operators responsible for sustaining MPCs often need to interpret the LP solution to understand the controller’s actions. Without easy interpretability, it is difficult to troubleshoot MPCs especially for large-dimensional controllers. To alleviate this difficulty, a systematic approach that facilitates LP solution diagnostics using tools from data visualization and process control is developed. The ‘partial pivoting’ operation - an industrial practice that has seen limited exposure in academic literature - is discussed in detail with regards to its role in LP solution diagnosis. Typical workflows for diagnosing problematic controllers are used in conjunction with data visualization principles to guide the design of new tools focused on visualizing variable constraint data that facilitate the diagnosis process. These proposed tools are designed using Munzner’s “Nested Model” as a guiding framework for visualization design and evaluation. The use of these tools is demonstrated in multiple industrial examples, with comparison to current industrial methodologies.
Read or Download: PDF